
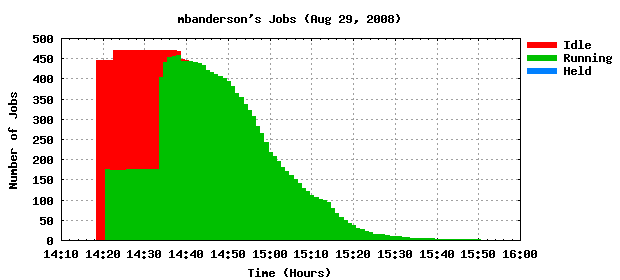
Auto-Updating a Time Graph with Gnuplot 4.2#
Michael Anderson#
Here is the main perl script which reads a log file, creates a gnuplot command file, runs gnuplot, and creates a webpage.#
#! /usr/bin/perl
#
# Reads from a data file,
# creates a gif plot, and
# makes a webpage to view it.
#
# Michael Anderson, July 5 2008

##################################################
# SECTION 1:
# Set variables for the locations and
# names of all the files.
$user = $ENV{'USER'};
$homeDir = "/afs/hep.wisc.edu/home/$user";
$logfile = "$homeDir/jobMonitor.log";

# The webpage and gif file will be placed in webDir
$webDir = "$homeDir/www";
$webPage = "jobMonitor.php";
$imgFile = "jobMonitor.png";

# Temp files and executable locations
$gpfile = "/tmp/gnuplot_$$.gp";
#$GNUPLOT = "gnuplot";
$GNUPLOT = "/afs/hep.wisc.edu/cms/sw/gnuplot/bin/gnuplot";
$farmoutSumLog = "/tmp/$user-farmoutSummary.log";
##################################################


##################################################
# SECTION 2:
# Get today's date
$datestr = `date`;
# remove the newline character
chop $datestr;
# put the day of week, month, etc, into variables
($dow, $mon, $day, $hour,
 $min, $sec, $zone, $year) = split (/[ ]+|:/, $datestr);
# set date to day month year
$date = sprintf ("%02d/%s/%d", $day, $mon, $year);
##################################################


##################################################
# SECTION 3:
# Write the gnuplot command file
open (GPFILE, "> $gpfile");
# Everything after the following line up to the
# terminating "EOM" line defines the contents of
# the gnuplot command file.
print GPFILE <<EOM;
set terminal png transparent nocrop enhanced size 620,280
set output '$webDir/$imgFile'
set grid
set title "$user\'s Jobs ($mon $day, $year)"
set xlabel "Time (Hours)"
set ylabel "Number of Jobs"
set key reverse Left outside
set key autotitle columnheader
set xdata time
set timefmt "%m-%d-%H:%M"
set format x "%H:%M"
set style fill solid 1.00 noborder
# Main plot command
# This will stack the data
plot "$logfile" using 1:(\$3+\$4+\$5) title 3 with boxes, ''
using 1:(\$4+\$5) title 4 with boxes, '' using 1:5 title 5
with boxes
EOM
close GPFILE;

##################################################
# SECTION 4:
# Run gnuplot with the above created command file
system ("$GNUPLOT $gpfile");
# Now delete the gnuplot command and data file
unlink ($gpfile, $datafile);
##################################################


##################################################
# SECTION 5:
# Output an HTML page to display the graphic we
# just generated.

#Top half of web page
open (WEBPAGE, "> $webDir/$webPage");
print WEBPAGE <<EOM;
<HTML>
<META HTTP-EQUIV="REFRESH" CONTENT="120">
<HEAD>
 <title>Job Monitoring</title>
 <LINK REL="SHORTCUT ICON" HREF="http://www.hep.wisc.edu/cms/comp/cmsIcon.ico">
</HEAD>
<BODY>
<CENTER><IMG SRC=$imgFile><br>
Updated $mon $day, $hour:$min</CENTER>
<hr>
<pre>
EOM
close WEBPAGE;

# Farmout Summary information
system ("farmoutSummary > $farmoutSumLog");
system ("cat $farmoutSumLog >> $webDir/$webPage");

# Bottom half of web page
open (WEBPAGE, ">> $webDir/$webPage");
print WEBPAGE <<EOM;
</pre>
<hr>
<h2>Command cheat-sheet:</h2>
<?php include("/cms/www/comp/commands.php"); ?>
<hr>
<a href="http://www.hep.wisc.edu/cms/comp/userdoc.html">Wisconsin CMS User Documentation</a>
</BODY>
</HTML>
EOM
close WEBPAGE;
##################################################
The log file that the above perl script reads, for example, looks like:#
#PID 22561
#Log of jobs running on condor
#Started: Fri Aug 29 14:19:46 CDT 2008
MonthDayHourMin Total Idle Running Held
08-29-14:19 446 446 0 0
08-29-14:20 446 446 0 0
08-29-14:21 446 270 176 0
08-29-14:22 446 272 174 0
08-29-14:23 471 297 174 0
08-29-14:24 471 297 174 0
08-29-14:25 471 297 174 0
08-29-14:26 471 295 176 0
08-29-14:27 471 295 176 0
08-29-14:28 471 295 176 0
08-29-14:29 471 295 176 0
08-29-14:30 471 295 176 0
08-29-14:32 471 295 176 0
08-29-14:33 471 295 176 0
How you create a log like the above is your business, but if you want an example of how we do it, here’s the bash script:#
#!/bin/bash
#
# Essentially this runs condor_q <screen name>
# once every minute and stores that in a log file.
# Then runs a script to create a plot of that log file.
#
# Michael Anderson
# May 19, 2008
##################################################


##################################################
# Variables
#
# location to store the log file of jobs running
logFile="/afs/hep.wisc.edu/home/$USER/jobMonitor.log"

# max length of time to run this monitor (in minutes)
# BUT KNOW: the monitor will stop when jobs on queue = 0
#           OR when time running > maxTimeToMonitor
maxTimeToMonitor=7200
##################################################


##################################################
# See if the log file already exists.
# If true, this means jobMonitor already ran,
# which is ok, but we need to check if it is
# still running so as not to run another instance.
if [ -f "$logFile" ]; then
 # Logfile exists, check to see if jobMonitor is already
running
 lastPID=`head -1 $logFile | awk '{print $2}'`
 checkRunning=`ps -p $lastPID | grep $lastPID`
 if [ "$checkRunning"  ]; then
  #jobMonitor is already running, so don't run again
  exit
 fi
fi
##################################################


##################################################
# Make the user's web dir if it doesn't exist
mkdir -p /afs/hep.wisc.edu/home/$USER/www

# Create new log file
echo "#PID $$" > $logFile
echo "#Log of jobs running on condor" >> $logFile
echo "#Started: "`date` >> $logFile
echo "MonthDayHourMin Total Idle Running Held" >>
$logFile
##################################################


##################################################
# Run for a certain number of minutes
for ((i=0;i<=$maxTimeToMonitor;i+=1)); do

  # Update the log file containing jobs running, etc...
  # This will look something like:
  #   "10 jobs; 1 idle, 8 running, 1 held"
  jobString="`condor_q $USER | tail -1`"
  totalJobs=`echo $jobString | awk '{print $1}'`
  # This writes a string to the log file that looks like
  #   <month>-<day>-<hour>:<min> <total> <idle> <running> <held>
  # example: "08-29-14:19 446 446 0 0"
  echo `date +%m-%d-%H:%M`" "`echo $jobString | awk '{print $1" "$3" "$5" "$7}'` >> $logFile

  # Run the plot updater every 2 minutes
  if [ $((i % 2)) -eq 1 ]; then

    /cms/cmsprod/bin/updateJobMonitorGraph.pl

    # If there are no jobs left, quit
    if [ "$totalJobs" -eq 0 ]; then
      exit
    fi

    # It takes a little bit for the updater to finish,
    # so sleep less than normal.
    sleep 59

  else
    # Sleep for 60 seconds
    sleep 60
  fi

done
##################################################